

Koba
Active Member
Just how deep into the dysgenic pit is the new Canada, anyways? I decided to run a check. What is the current average IQ of populations in Canada? What's the sum average in total? What is it going to be?
Thankfully statistics Canada does keep some information on this topic. They are slavishly interested in the various minorities of course. This is how I came across these projections from 2022, the 2041 scenario where 53.1% of the country is white, 13.39% is broader asian, 11.9% is East Indian, 6.57% is black, 5.19% is Arab, and 2.17% is Latam. There's a mystery meat of 1.76% left over. Sounds like a paradise
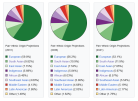
Now I must begin with the errata of how I obtained the results. You might want to skip ahead to the population estimates
Now here are my first pass figures for the IQ of the populations in Canada, tabled by percentage of the pop for the 2021 census. Our baseline for Canada today
White: IQ 99, 68.5%
East Indian: IQ 87.6, 7.1%
East Asia: IQ 104.1, 5.6%
First Nations (Indian): IQ 88.47, 5%
African: IQ 85.70, 3%
Southeast Asian (pacific): IQ 97.56, 3.7%
Middle Eastern: IQ 94.55, 2.9%
Latin America: IQ 95.60, 1.6%
Total Average IQ for Canada taken by percentage impact: 97.1 (!!)
My gut told me that was probably accurate. But looking at my derived estimates compared to the world IQ reference I was using, Canada should actually score 100.8. What was going on? Perhaps this was the elite human capital effect after all. The stoodents had such extremely high IQ's they were just the upper end of the bell curve for their society rather than the norm. Equally likely, it was some mild discrepency in sources since the Sebastien Jensen set I was using was very conservative with IQ values. Anyways, the discrepancy was 4.6 IQ points up. Rather than rewrite the bible looking for a small compiler error I just did the simple thing and added that discrepancy to the overall values.
so the adjusted IQ of Canadians to account for that difference would be
White: IQ 103.6, 68.5%
East Indian: IQ 92.2, 7.1%
East Asia: IQ 108.7, 5.6%
First Nations (Indian): IQ 93.07, 5%
African: IQ 90.3, 3%
Southeast Asian (pacific): IQ 102.16 3.7%
Middle Eastern: IQ 99.15, 2.9%
Latin America: IQ 100.2, 1.6%
Average IQ : 101.79
So a little higher than 100.8 meaning it is too optimistic, probably because it distributed all talents equally. But good enough to see the range of possibilities we're working with here. I'm going to call this the bluepilled version. The earlier one will be the redpilled version.
---
Now we can do the 2041 projections just by scaling the IQ estimates to new percentage figures. Superpower 2041?
Here's the optimistic Bluepill version:
White: IQ 103.6, 53,1%
East Indian: IQ 92.2, 11.9%
East Asia: IQ 108.7, 7.85%
First Nations (Indian): IQ 93.07, 5.97%
African: IQ 90.3, 6.57%
Southeast Asian (pacific): IQ 102.16 5.54%
Middle Eastern: IQ 99.15, 5.19%
Latin America: IQ 100.2, 2.17%
Total IQ: 100.7
Here's the pessmistic Redpill version:
White: IQ 99, 53.1%
East Indian: IQ 87.6, 11.9%
East Asia: IQ 104.1, 7.85%
First Nations (Indian): IQ 88.47, 5.97%
African: IQ 85.70, 6.57%
Southeast Asian (pacific): IQ 97.56, 5.54%
Middle Eastern: IQ 94.55, 5.19%
Latin America: IQ 95.60, 2.17%
Total IQ: 96.1
So the superpower 2041 IQ projections for Canada would at worst put it in the ballpark of Ukraine at (IQ 96.1) or Greece (IQ 95.8). I am much more inclined to consider these lower figures than continuing the fiction of Canada being a IQ 100 West European-level IQ country, even if the optimistic scenario has it only shedding a few points and staying at 100 levels. The optimistic scenario is predicated on Canada continuing a more rigorous selection program screening for talent, when it is clear standards are generally nonexistent. The 2041 scenario also uses a continuation of existing immigration sources to get numbers, and I think it very likely that more and more low quality destinations will end up supplanting those.
Either way the country is experiencing downwards dysgenic IQ selection and will continue on that path probably indefinitely. A lot of research has gone into examining the association between national wealth, productivity and average IQ. The truth is that a 1 IQ point average increase causes a 6% higher GDP for nations. That 1 point slide is exactly what will happen to Canada under the 2041 dysgenic immigration selection scenario, and we are likely to be that much poorer as a result.
Thankfully statistics Canada does keep some information on this topic. They are slavishly interested in the various minorities of course. This is how I came across these projections from 2022, the 2041 scenario where 53.1% of the country is white, 13.39% is broader asian, 11.9% is East Indian, 6.57% is black, 5.19% is Arab, and 2.17% is Latam. There's a mystery meat of 1.76% left over. Sounds like a paradise
Now I must begin with the errata of how I obtained the results. You might want to skip ahead to the population estimates
There are also tables specifically on each subgroup to find population of origin, for example https://www150.statcan.gc.ca/n1/pub/89-657-x/89-657-x2026006-eng.htm, https://www150.statcan.gc.ca/n1/pub/89-657-x/89-657-x2024005-eng.htm etc.
From there, the reasoning was simple enough. I needed an dataset to match the population from country of origin to IQ values. The internet is full of tables and maps, some of it more speculative than others. I settled on the https://cognitivemetrics.com/calculator/world-map dataset which comes from a blogger named Sebastian Jensen. Further inquiries showed Jensen worked for Emil O. W. Kirkegaard, who is one of the top figures in HBD, so that was good enough for me. There were a number of shortcuts that could have been taken. IQ figures have been produced as generalizations for regions and some corners could be cut to plug those in. But I decided to try and be more specific, since Canada is taking only specific groups from specific places on average to try and closer fit.
For instance rather than just using vague categories like so-called Middle eastern from the Canadian census, I broke those down into the original categories for country-of-origin IQ estimates, and then adjusted the overall average of these IQ numbers by the overall percentage influence on the whole from each region too. This may sound confusing, so I'll give an example. For the census category of Africa, it turned out Ghana (IQ 81) was 8.9% of the category total, Eritrea (IQ 83) was 9.9% of that total, Cameroon such and such for 7 values total. The Average IQ from this category was then computed using each value by percentage of a whole, rather than simply averaging the IQ between all 7 categories. So in that case it was 81.1 on average as the IQ for all african immigrants in Canada by that tally.
In many categories I had to get very clever. There would inevitably be a very small category, for example all other north africa in the arab category, where I would have to pull a number based on approximations. This would typically be obtained by summing the average IQ for the subcomposite regions and then averaging it. In some such as Whites, where canada pays far less attention to their existence statistically, I had to get rather tricky because even that was harder to find.
For Canadian First nations, no such value existed to compare them to at all, so I had to pull a number from the Human Varities blog (https://humanvarieties.org/2025/05/...rritories-part-1-aboriginal-test-performance/), which was summarized as 88.47. This is a very amusing rabbit hole to research, because the guilt-ridden actual researchers are constantly trying to pretend the test results have no validity. For example one of these phoney researcher suggests : "The use of standardized intelligence tests to place students could temporarily be replaced by the teacher who is in the best position to evaluate the student. This assumes that a teacher's evaluation is more appropriate than an IQ test.". Imagine claiming teacher eyeball estimates are how you woudl get comparative IQ results
to compare 2021 census figures to 2041 estimations I was obligated to transform certain categories into a shared one, for example East asian came from Korean + Japan + China averaged
Now here are my first pass figures for the IQ of the populations in Canada, tabled by percentage of the pop for the 2021 census. Our baseline for Canada today
White: IQ 99, 68.5%
East Indian: IQ 87.6, 7.1%
East Asia: IQ 104.1, 5.6%
First Nations (Indian): IQ 88.47, 5%
African: IQ 85.70, 3%
Southeast Asian (pacific): IQ 97.56, 3.7%
Middle Eastern: IQ 94.55, 2.9%
Latin America: IQ 95.60, 1.6%
Total Average IQ for Canada taken by percentage impact: 97.1 (!!)
My gut told me that was probably accurate. But looking at my derived estimates compared to the world IQ reference I was using, Canada should actually score 100.8. What was going on? Perhaps this was the elite human capital effect after all. The stoodents had such extremely high IQ's they were just the upper end of the bell curve for their society rather than the norm. Equally likely, it was some mild discrepency in sources since the Sebastien Jensen set I was using was very conservative with IQ values. Anyways, the discrepancy was 4.6 IQ points up. Rather than rewrite the bible looking for a small compiler error I just did the simple thing and added that discrepancy to the overall values.
so the adjusted IQ of Canadians to account for that difference would be
White: IQ 103.6, 68.5%
East Indian: IQ 92.2, 7.1%
East Asia: IQ 108.7, 5.6%
First Nations (Indian): IQ 93.07, 5%
African: IQ 90.3, 3%
Southeast Asian (pacific): IQ 102.16 3.7%
Middle Eastern: IQ 99.15, 2.9%
Latin America: IQ 100.2, 1.6%
Average IQ : 101.79
So a little higher than 100.8 meaning it is too optimistic, probably because it distributed all talents equally. But good enough to see the range of possibilities we're working with here. I'm going to call this the bluepilled version. The earlier one will be the redpilled version.
---
Now we can do the 2041 projections just by scaling the IQ estimates to new percentage figures. Superpower 2041?
Here's the optimistic Bluepill version:
White: IQ 103.6, 53,1%
East Indian: IQ 92.2, 11.9%
East Asia: IQ 108.7, 7.85%
First Nations (Indian): IQ 93.07, 5.97%
African: IQ 90.3, 6.57%
Southeast Asian (pacific): IQ 102.16 5.54%
Middle Eastern: IQ 99.15, 5.19%
Latin America: IQ 100.2, 2.17%
Total IQ: 100.7
Here's the pessmistic Redpill version:
White: IQ 99, 53.1%
East Indian: IQ 87.6, 11.9%
East Asia: IQ 104.1, 7.85%
First Nations (Indian): IQ 88.47, 5.97%
African: IQ 85.70, 6.57%
Southeast Asian (pacific): IQ 97.56, 5.54%
Middle Eastern: IQ 94.55, 5.19%
Latin America: IQ 95.60, 2.17%
Total IQ: 96.1
So the superpower 2041 IQ projections for Canada would at worst put it in the ballpark of Ukraine at (IQ 96.1) or Greece (IQ 95.8). I am much more inclined to consider these lower figures than continuing the fiction of Canada being a IQ 100 West European-level IQ country, even if the optimistic scenario has it only shedding a few points and staying at 100 levels. The optimistic scenario is predicated on Canada continuing a more rigorous selection program screening for talent, when it is clear standards are generally nonexistent. The 2041 scenario also uses a continuation of existing immigration sources to get numbers, and I think it very likely that more and more low quality destinations will end up supplanting those.
Either way the country is experiencing downwards dysgenic IQ selection and will continue on that path probably indefinitely. A lot of research has gone into examining the association between national wealth, productivity and average IQ. The truth is that a 1 IQ point average increase causes a 6% higher GDP for nations. That 1 point slide is exactly what will happen to Canada under the 2041 dysgenic immigration selection scenario, and we are likely to be that much poorer as a result.
Upvote
4